

Reading the Rumble: A Maintenance Tech’s Guide To Vibration Analysis
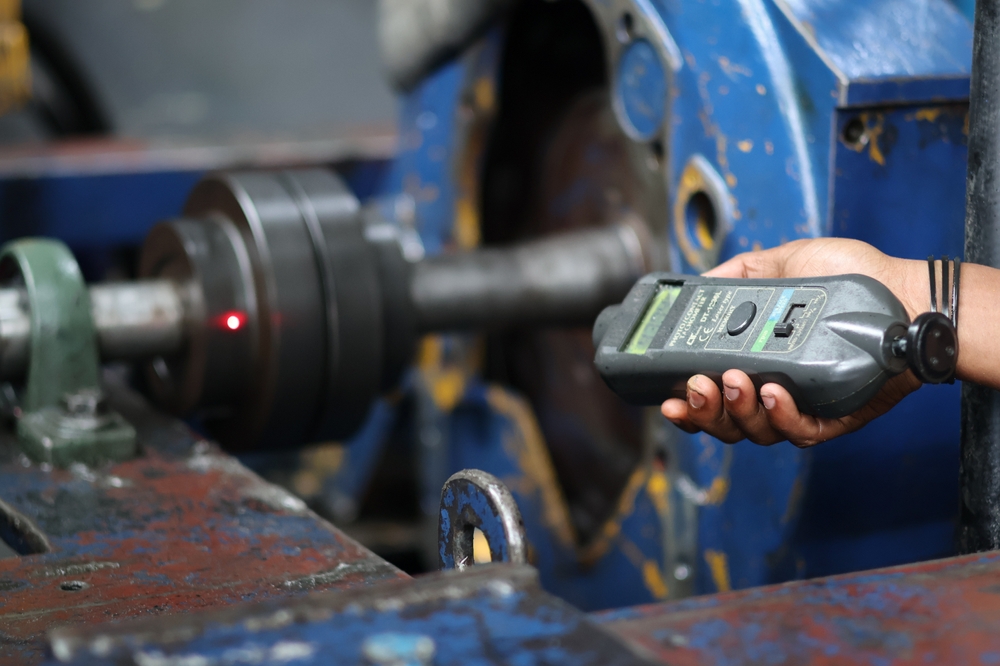
Every rotating machine vibrates. In a healthy machine, that vibration is low and stable. When something changes mechanically, the vibration changes too, and it does so in predictable ways. Vibration analysis is the practice of reading those changes before they become failures.
A technician who understands what the frequency spectrum is saying has weeks or months of warning before most rotating equipment faults become failures. The rumble is already there. It just needs to be read.
Overall level vs. frequency spectrum
A vibration meter that gives a single overall level tells you something has changed. It’s the trending tool that triggers an investigation. What it can’t tell you is why. That’s where Fast Fourier Transform (FFT) spectrum analysis comes in.
FFT breaks the raw vibration signal into individual frequency components, and each fault type leaves a characteristic fingerprint in the spectrum:
- 1x running speed dominant peak = imbalance
- 1x and 2x running speed with elevated axial vibration = misalignment
- Multiple harmonics with unstable amplitude = looseness
- Non-synchronous frequencies at calculated bearing defect values = bearing damage
- Gear mesh frequency with sidebands = gear wear
What each signature means
The fault signatures above point to a specific mechanical condition and a specific repair path. Here’s what they look like on the floor:
- Imbalance shows up as a dominant peak at 1x shaft speed with little else in the spectrum. It’s the most common vibration fault and usually correctable with field balancing, if it’s caught before the uneven loading has done secondary damage to the bearings.
- Misalignment produces strong energy at 1x and 2x running speed, often with a notable axial component. Replacing bearings without correcting the alignment first just starts the clock over. The new bearings inherit the same load that the old ones couldn’t handle.
- Looseness generates a forest of harmonics, sometimes extending to 10x running speed or beyond, with amplitudes that shift between readings. Foundation bolts, bearing housing fits, and shaft-to-hub connections are the first places to check.
- Bearing damage rewards early detection more than any other fault. Defect frequencies appear in the high-frequency range weeks to months before they show up in the standard velocity spectrum. Once they appear with sidebands in the velocity spectrum, the damage has progressed, and replacement is the right call.
How trending makes the data useful
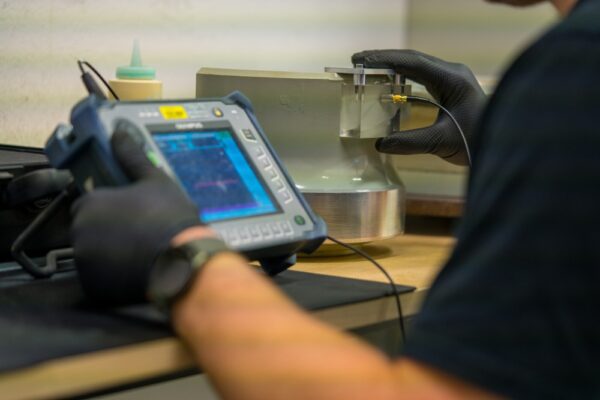
A single vibration reading is a snapshot. The value of vibration analysis is in the trend, comparing current readings against a known baseline and watching the rate of change. A bearing developing a defect may read slightly elevated for months before the amplitude starts climbing sharply. A sudden jump on a machine that’s been stable for a year is a different story than a gradual rise over the same period. Both matter, but they call for different responses.
Getting useful trends requires consistency: same measurement points, same sensor placement, same load conditions. Baseline readings on healthy equipment are the reference against which everything else gets measured. Without them, the numbers have no context.
The rumble already has something to say
Most rotating equipment faults give weeks or months of warning in the vibration data before they produce a failure. Imbalance, misalignment, looseness, bearing damage, gear wear — all of it shows up in the spectrum before it shows up as downtime. A technician with a basic understanding of frequency signatures and a consistent measurement log has most of what’s needed to catch those faults in time.
