Using a Fishbone Diagram to Get to the Root of Maintenance Issues
A fishbone diagram — often called an Ishikawa diagram or a 5M framework — is a mode of root-cause analysis. It’s particularly effective for troubleshooting consistent issues, making it a critical resource for maintenance managers. Incorporating a fishbone diagram as part of a thorough, evaluative approach to reactive maintenance can yield exceptional insight. But to use this analytical method properly, you need to understand its principles and approach.
An organized approach to causality
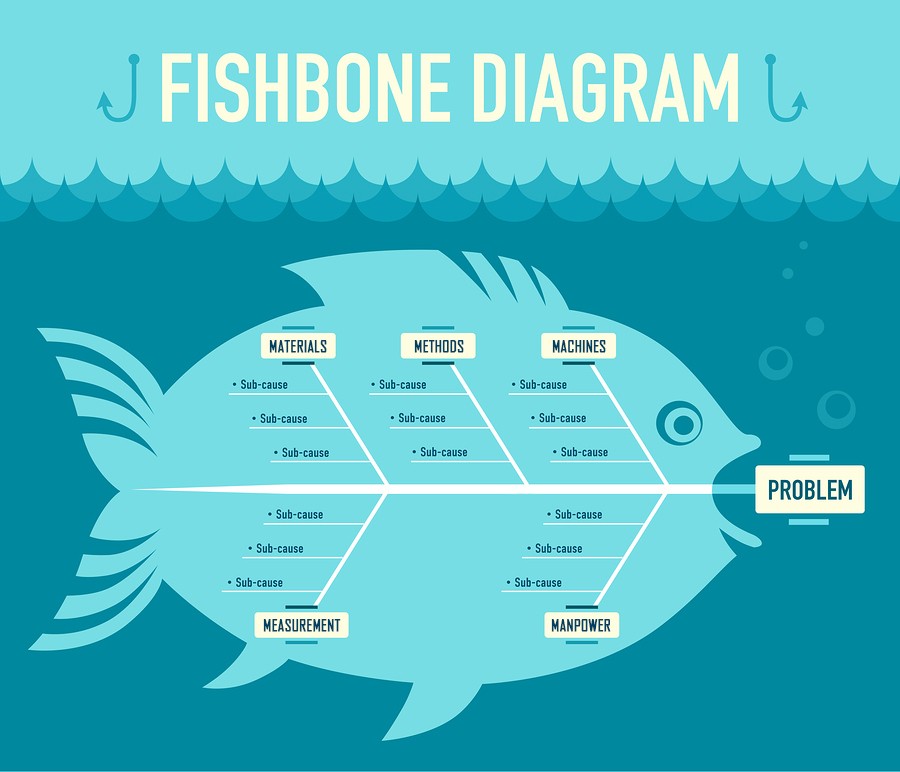
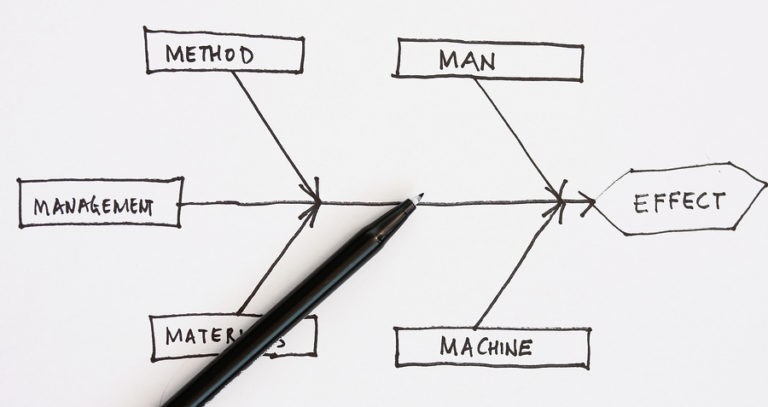
Every fishbone diagram begins the same: An arrow pointing to the problem. Five distinct branches come off of that arrow, each representing an area of focus when determining the cause of the issue.
- Machine (equipment)
- Method (process)
- Material (consumables)
- Manpower (operator)
- Measurement (inspection)
From each defined branch, the factors contributing to that area of focus are also listed, creating a bone-like structure that serves as the moniker for the diagram. It’s a tool that promotes thorough evaluation of each factor and lays each out plainly for easy investigation.
Fishbone diagrams have the same principles as other Failure Modes and Effects Analysis (FMEA) approaches. The goal is to organize systems in a way that promotes traceability of a specific issue. It’s a close cousin of the causal factor tree and Kepner-Tregoe change analysis.
Steps to coordinating a fishbone diagram
A fishbone diagram can be as complex as necessary to trace an issue back to its cause. Due to the methodical nature of creating a diagram, the process is the same regardless of the depth of the evaluation. There are six steps to every fishbone diagram:
1. Problem statement — This step simply identifies the problem. It’s the “backbone” of the fishbone diagram. From this step, the entire diagram will involve working backwards.
2. Categorization — This is the branching of the five Ms from the backbone, identifying the core areas of focus for possible problem identification.
3. Contributing factors — This step involves brainstorming possible causes for each core area of focus and listing them as branches on the diagram.
4. Investigation — Here, techs evaluate each possible contributing factor on the diagram. This process is often its own modality for investigation, called the Five Whys.
5. Branching — As brainstorming yields answers, they’re attached to each branch on the fishbone diagram for future testing.
6. Testing — Each probable cause requires testing. This final step serves to validate the ultimate cause of a problem by evaluating all viable causes.
A fishbone diagram is as much a visual tool as a logical one. Maintenance operators will see not only the catalyst for the main problem but also contributing factors to that catalyst.
Facilitating a better standard of maintenance
The biggest advantage of using a fishbone diagram is ease of collaboration. When drawn on a whiteboard, for example, it’s easy for multiple techs to participate in the discussion. Fishbone diagrams foster creative thinking because they combine visual diagramming with problem-solving.
Fishbone diagrams are also the perfect juxtaposition of compact and organized. Each stem maintains the integrity of the diagram, while giving techs complete focus on a causal pathway. And a diagram is easy enough for anyone to use, making it a baseline tool for all maintenance techs.
A fishbone diagram not only helps solve problems but also fosters better problem-solving skills in your maintenance personnel. Make sure it’s part of your routine approach to FMEA.
Having trouble pinpointing the cause of consistent machine failure in your factory? Let the professionals at Global Electronic Services take a shot. Contact us for all your industrial electronic, servo motor, AC and DC motor, hydraulic, and pneumatic needs — and don’t forget to like and follow us on Facebook!