Ishikawa Diagrams and Reliability
Equipment reliability is top-of-mind for every manufacturer. Unplanned downtime is the bane of any value stream, and proactive maintenance requires a tactical approach. To keep machinery up and running and operating efficiently, cultivate a keen awareness of the factors contributing to reliability. World-class manufacturing companies use Ishikawa diagrams to plot out the factors affecting machine reliability as part of a comprehensive problem-solving approach.
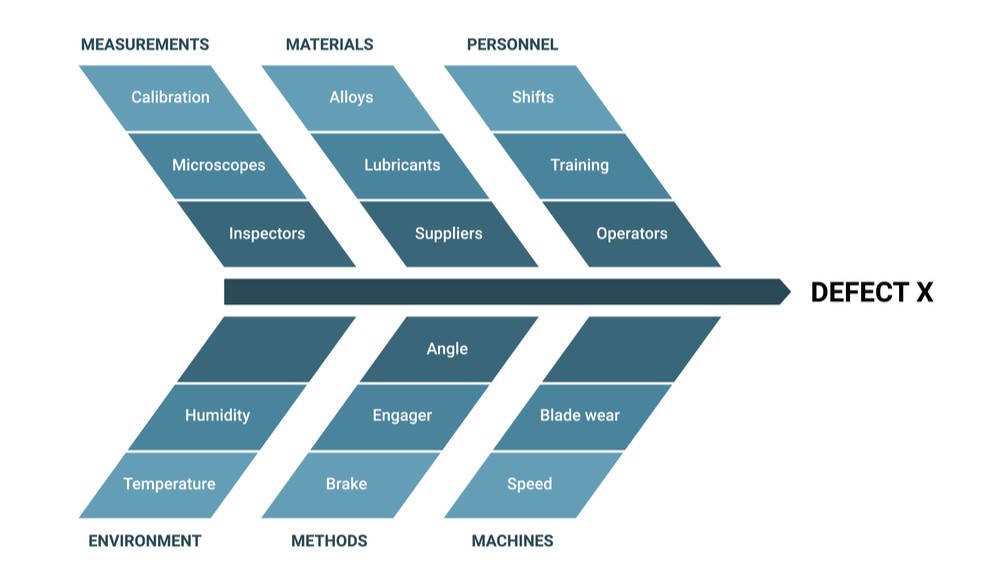
Dissecting a fishbone diagram
Ishikawa diagrams are brainstorming tools for analyzing and identifying a problem and its causes. They’re also referred to as fishbone diagrams because their design features a horizontal line with other lines branching from it, giving them the appearance of a fish skeleton. The problem appears at the end, or “head,” of the horizontal line, and the causes are recorded along the branches.
Using an Ishikawa Diagram to identify all the causes, factors, and variables of a problem makes it easier to visualize and generate solutions. By developing better solutions for managing equipment failure, manufacturers increase value stream reliability.
Core considerations for Ishikawa Diagrams
To properly assess and solve equipment problems, a team must first identify the five key measures of an Ishikawa diagram. These measures include:
- Methods. What are the specific requirements for solving a problem? Should you consult an SOP document or work with a technical specialist? How do you approach the issue?
- Machines. What equipment and tools are required to solve the problem? Do you have these instruments on-hand, or do you need to procure them specially?
- Labor. How many people does a team need to solve the problem? What skills should those people have? Would it be better to use in-house workers or hire contractors?
- Materials. What parts do you need to fix broken equipment? Are they in inventory, or do you need to order them? What are the costs and lead times associated with purchasing parts?
- Measurement. During the process, take down measurements that relate to the problem. Quantify the problem and the solutions necessary to remedy it.
For the best results, consider all five key measures when building an Ishikawa diagram. Nailing down the root cause(s) of a problem keeps the focus on how best to address them to resolve the overall issue.

Understanding the forces at work
When used correctly, the Ishikawa diagram is one of the best tools for problem solving, but the process does have a learning curve. Consider drawing your initial efforts on a dry erase board to make adding and removing items easier. Leave enough room between major categories to fill in relevant details.
Encourage every maintenance and machine operating team member to participate in Ishikawa diagram exercises. Full team participation helps techs get more familiar and comfortable with the process and brings out their best ideas. Get everyone involved by asking each team member to contribute at least one potential cause and working through the diagram branches together to identify potential solutions.
While commonly used as a root cause analysis tool, manufacturers should also recognize the potential of Ishikawa diagrams for enhancing machine reliability. Charting the variables and factors affecting machine performance — before problems have a chance to take root — puts maintenance teams ahead of the curve for understanding the stressors that lead to equipment failures. Ishikawa diagrams are a comprehensive first step on the path to proactive maintenance and increased reliability.